Daily technical analysis for EURUSD, Gold, GBPUSD, GBPJPY with the chart for 13 April 2020. At the beginning of the week, most of the pairs are in slow mode. Price is staying on range mode. We can wait for the breakout of the range zone. We will discuss the technical outlook of these four pairs.
EURUSD Chart Analysis
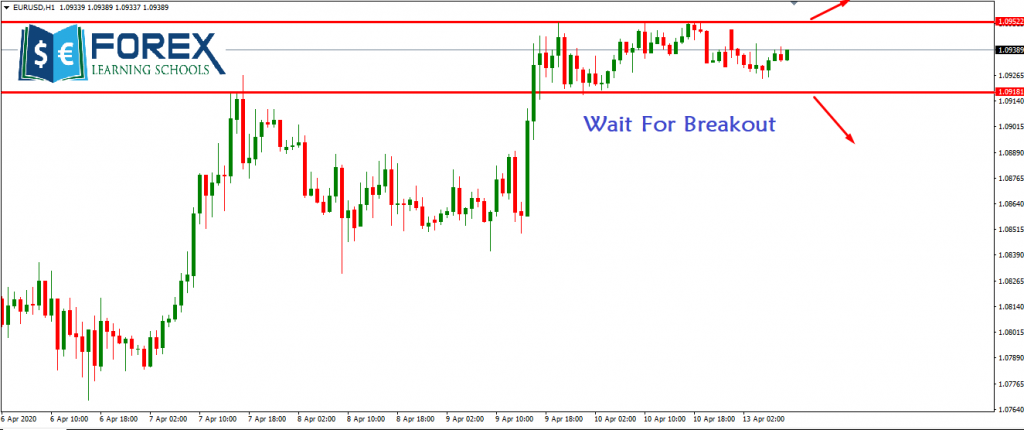
On the chart, we can see, this pair is moving on a certain area marked on the picture. Range zone 1.0918-1.0952. Any breakout of this zone will indicate for next movement.
We recommendation is to stay on bullish mode. If it break upside, 50-80 pips movement can be expected from this pair. At that case, SL will be below 1.0918 support level.
GOLD Chart Analysis

On Gold chart, we can see doji candle on H4 chart. It indicates confusion between buyers and sellers. So we should avoid these type of conditions. We can wait for breakout of these zone.
We can stay on bullish mode on Gold. 1692 level can be key level for Gold. After breakout this level, 1700 can be expected. SL will be near to swing support level.
GBPUSD Chart Analysis

On the chart, We can see this pair is waiting for a breakout. We should look for a breakout of this triangle. We will get good upside movement is this pair break on the upper level. 60-100 pips movement can be expected if it breaks 1.2490 resistance level
GBPJPY Chart analysis

On the chart, we can see this pair has broken wedge pattern, then it fall down near to support level. If it breaks this support, we will get further downside movement on this pair.
On the other side, above this support level, we can expect bullish movement on this pair targeting 135.20.